- 4 Posts
- 10 Comments


 2·1 year ago
干嘛那么凶,别人就问一句问题
 1·1 year ago
deleted by creator
I used the greasymonkey script with tampermonkey without any modification. And it seems like that script magically worked even though the code doesn’t look like it applies to all of the cases. Thanks, this helped a lot.
Update: After further testing, the script doesn’t really help a lot, because it broke all the JavaScript used on that website all together, which explains why the debugger stopped spamming. Disabling all the JavaScript is not what I want; I want to be able to use the browser tools to trace certain functions.
curl the source down works, but it makes things more complicated. The source code is obfuscated making it incredibly hard to read. This is where using the web debugging tools shine. If I want to figure out which code is trigger what, I can just look at the call stack. I also wanted to look at the internet traffic to see how things work from there. I could intercept all the HTTP requests but that wouldn’t give things like the call stack. I think it would be much easier if there’s a way stopping the debugger spamming trick.
oh that forever loop caused my browser to crash
That icon did skip over the debugger keyword, but it didn’t solve my issue because it still prevented me from viewing that website’s source. Now the websites just becomes super laggy. I’m assuming that there’s a forever loop that does nothing running in the background now that the
debuggerkeyword constantly gets skipped over.Can there be a solution where I can replace
debuggerto something that can cause the thread to sleep for like half a second?
that doesn’t work because the debugger spam spawns a new console/thread or whatever; making a “new file” every time the spam started. There’s no fixed line number to skip over.
can someone confirm if this is the real oldest lemmy post?
the oldest commit on github seems like its made about 4 years ago

 2·1 year ago
What does this mean? Is this latex?


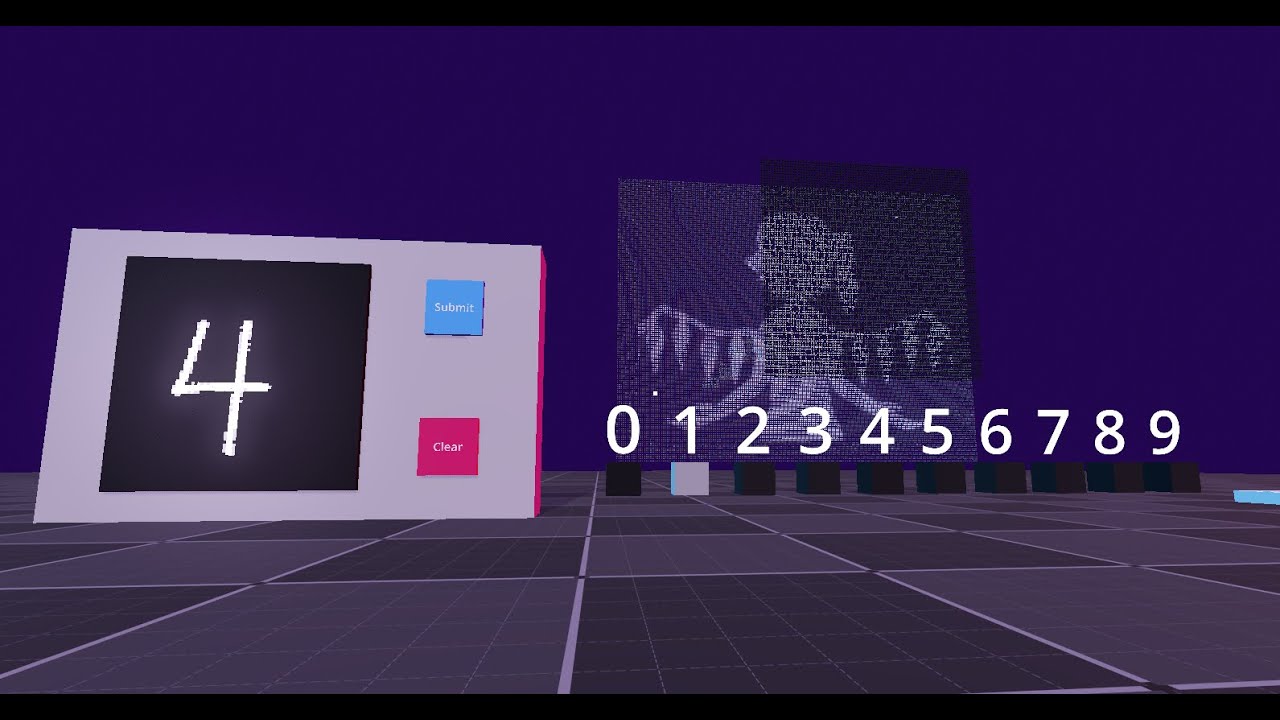
Sure, the role of neural network used in this project is recognizing hand written digits. The input is a 81x81 2D grid. There are a few fully-connected layers trying classify all these input pixels into 10 possible outputs and assign each output with a probability. The outputs are the 10 digits in our number system.
This model is trained using pytorch, a machine learning framework, and exported to onnx. The onnx file then gets used by a backend server written in python that will communicate with godot.
The math behind how fully-connected layers work is a little complicated. If you want to get into the details of how exactly machine “learns” you should go watch some youtube tutorials about back-propagation and statistic modeling.
The tricky part here is embedding an entire video (bad apple in this case) into the weights of the fully-connected layers. Training the model with custom-set limitations was really hard. This model’s accuracy at guessing a human’s handwriting correctly is only about 60% based on the augmented dataset that it was tested on.
I think it’s lemmy’s parsing issue that the “The” word and the repo link got merged